Data Management & Analysis In Research
A practical approach
Faculty of Family Medicine Workshop
April 28, 2023
Dr Samuel Blay Nguah FWACP FGCPS
Workshop outline
Data Management
- Databases software
- Database design & validation
- Data verification
- Double
- Single
- Data warehousing
- Data migration
- Data cleaning
Data Analysis
- Planning your analysis
- Text, dummy tables and figures
- Software
- Data cleaning and missing data
- Descriptive statistics
- Continuous variables
- Categorical variables
- Inferential statistics
- Hypothesis testing
- P-values
- Confidence interval
- Graphical presentations
Our study for the day
Aim
- Determine if New Drug has a better BP lowering effect after 2 weeks of administration compared to the Control Drug
Study type
- Randomized Controlled Trial
Variable to be collected
- Age in years
- Sex
- Initial BP
- Final BP
Our study for the day
Study questions
- How much does the New drug lower the BP?
- How much does the Control drug lower the BP?
- Which of the two drugs lowers the BP better?
- Is there a difference in the BP lowering effect of the two drugs?
- Is the BP lowering effect related to the age of the patient?
- Is the BP lowering effect related to the sex of the patient?
Our study for the day
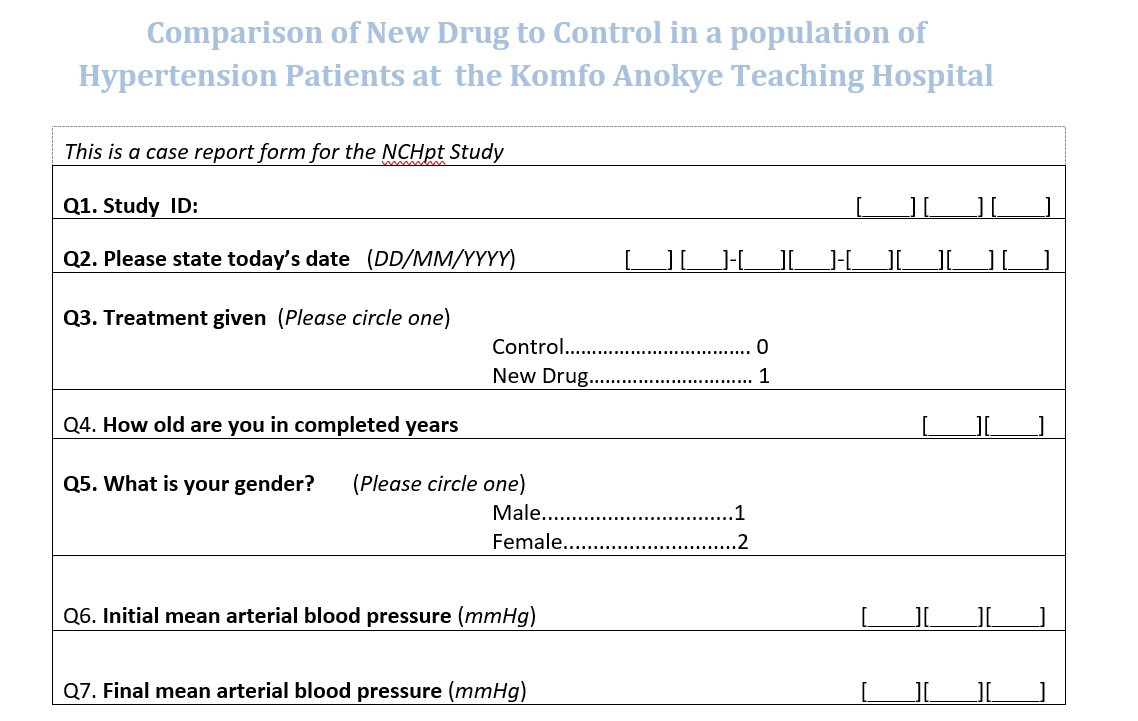
Data Management
Data management software


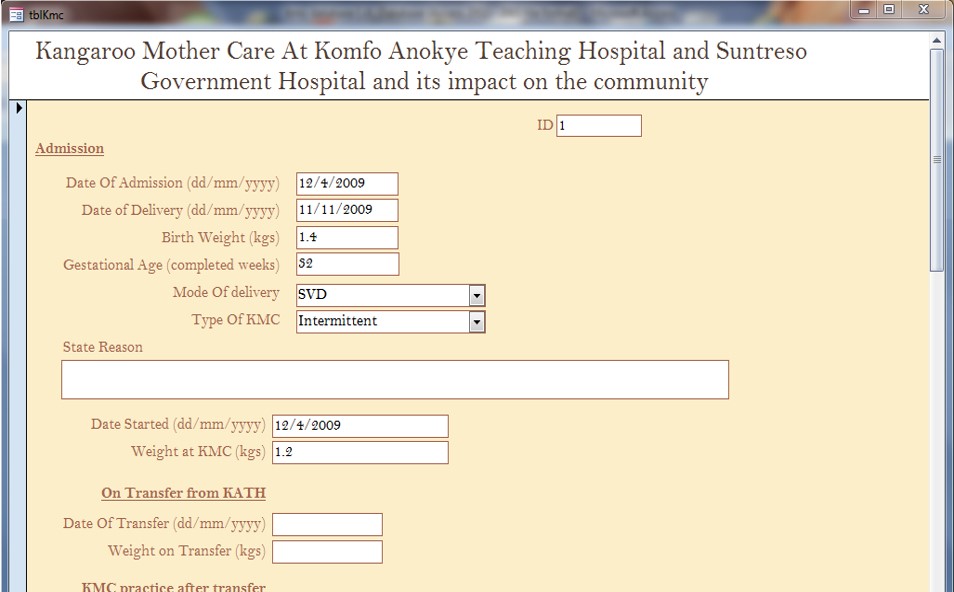
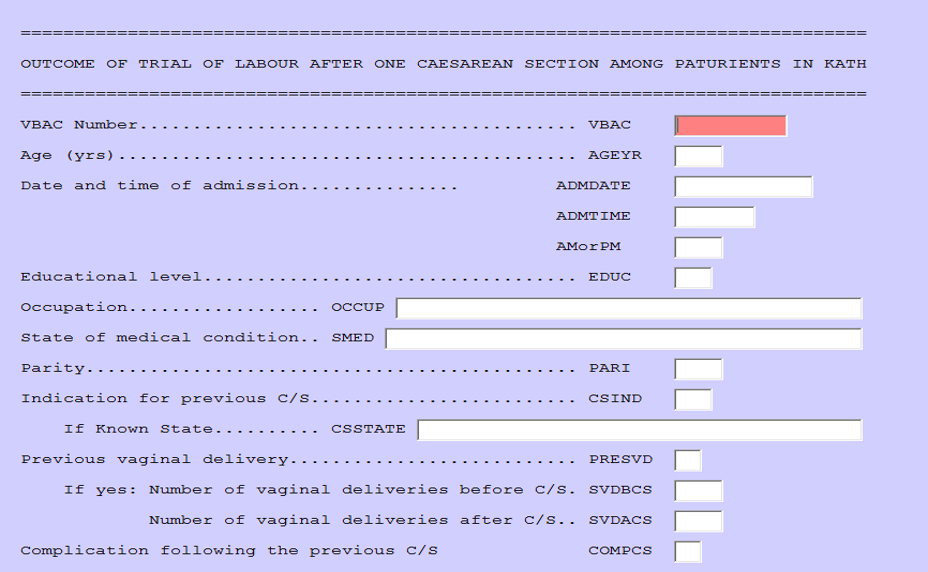
Database design, validation and verification
Validation
- Limits
- Valid ranges
- Allowable values
- Some software better than others
Cleaning
- Regular review of filled questionnaires
- Weekly checking of entered data for correctness
Verification
- Single entry
- 10% verification
- Whole database verification
- Double entry
- Create identical database
- Double enter data
- Picks data entry errors
- Compare the data from both databases
- Identify discrepancies
- Correct errors as necessary
Data Warehousing, migration & cleaning
Warehousing
- Backup the data regularly – 3 copies
- Backup with versions and dates
- Keep in the appropriate format
- Microsoft Excel
- Text files
- Tiff
Migration
- Moving data around
- Should be in stable state
- Not all software requires this
Cleaning
- Involves picking out erroneous data
- Picks up
- Data collection errors
- Data entry errors
- Strategy depends on
- Continuous variable
- Discrete variable
- Categorical
- Etc
Data Analysis
Data Types
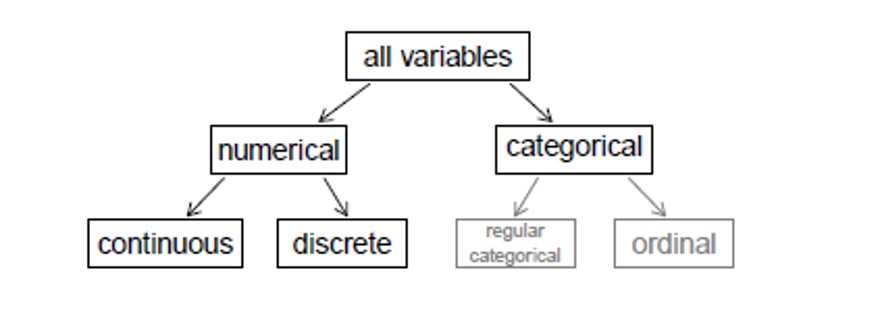
Variable types
Independent (predictor) variable
- Potentially influences, affects or predicts another variable
- E.g: How age influences income make age the independent variable
Dependent (predicted) variable
- Potentially predicted, influenced and affected by another variable
- E.g: How age influences income make income the dependent variable
Data analysis
Software
- R - Analysis only
- Microsoft Excel - Entry and analysis
- Stata - Analysis only
- SPSS - Entry and analysis
Know your data
Variables
id= Study IDtreat= Treatment givenage= Age of participantsex= Sex of patientbp1= Initial mean arterial BPbp2= Final mean arterial BP
| id | treat | age | sex | bp1 | bp2 |
|---|---|---|---|---|---|
| C1 | 0 | 63 | F | 97.4 | 93.1 |
| C2 | 0 | NA | F | 97.2 | 92.4 |
| C6 | 0 | 62 | F | 103.4 | 99.7 |
| C7 | 0 | 61 | F | 290.1 | 88.4 |
| C9 | 0 | 73 | F | 96.4 | 91.1 |
| C10 | 0 | 57 | F | 98.6 | 90.5 |
| C13 | 0 | 61 | F | 97.4 | 93.8 |
| C14 | 0 | 999 | F | 97.4 | 92.6 |
| A18 | 0 | 51 | F | 92.2 | 86.2 |
| A20 | 0 | 65 | F | 96.9 | 90.4 |
| A21 | NA | 65 | F | 102.6 | 91.5 |
| C3 | 0 | 54 | M | 98.8 | 94.6 |
| C4 | 0 | 69 | M | 98.4 | 92.3 |
| C5 | 0 | 75 | M | 89.8 | 89.3 |
| C8 | 0 | 59 | M | 93.7 | 90.4 |
Summarizing data
id treat age sex Length:50 Min. :0.0000 Min. : 45.00 Length:50 Class :character 1st Qu.:0.0000 1st Qu.: 57.75 Class :character Mode :character Median :1.0000 Median : 63.00 Mode :character Mean :0.5714 Mean : 81.00 3rd Qu.:1.0000 3rd Qu.: 65.00 Max. :1.0000 Max. :999.00 NA's :1 NA's :2 bp1 bp2 Min. : 87.5 Min. :78.00 1st Qu.: 96.0 1st Qu.:85.20 Median : 98.0 Median :88.40 Mean :102.4 Mean :88.61 3rd Qu.:101.2 3rd Qu.:92.30 Max. :290.1 Max. :99.70 NA's :1 NA's :1Pre-processing of data
Data cleaning
- Involves picking out erroneous data
- Picks up
- Data collection errors
- Data entry errors
- Strategy depends on
- Continuous variable OR Discrete variable
Steps (personal)
- Check study id
- Any duplication in whole data?
- Any duplication in study id?
- Any missing study id?
- Sort them out if possible
- General overview of data
- single categorical variables
- Single continuous variables
- Combination of variables – Categorical
- Combination of variables - Continuous
Pre-processing of data
Missing data
- Know the pattern
- Know how to deal with them
- Dropping observations
- Imputation
- Commonest observation
- Median/Mean
- MICE
Missing pattern

Pre-processing of data
Generating new variables
- Convert data to appropriate types
sexto categorical variable (factor)treatto categorical variable
- Fill missing data with appropriate data
- Correct abnormal values in BPs
- Generate variable(s)
bp_diff= Difference in BPage_group:- Elderly: >60 years
- Middle age: <=60 years
Data summary after cleaning
id treat age sex bp1 Length:50 Old Drug:22 Min. :45.00 Female:26 Min. : 87.50 Class :character New Drug:28 1st Qu.:57.25 Male :24 1st Qu.: 95.62 Mode :character Median :63.00 Median : 97.70 Mean :61.48 Mean : 98.30 3rd Qu.:65.00 3rd Qu.: 99.40 Max. :75.00 Max. :111.70 bp2 bp_diff age_group Min. :78.00 Min. : 0.500 Middle age:17 1st Qu.:85.22 1st Qu.: 4.800 Elderly :33 Median :88.15 Median : 8.250 Mean :88.60 Mean : 9.704 3rd Qu.:92.10 3rd Qu.:13.700 Max. :99.70 Max. :26.300Descriptive statistics
Categorical variable
- Frequency tables – univariate
- Contingency tables – bivariate
- Row percentage
- Column percentage
- Graphical representations
- Bar chart
- Pie Chart
- Others
- Odds & Odds Ratio
- Risk & Risk Ratio
Continuous Variable
- Measures of central tendency
- Mean
- Arithmetic Mean
- Geometric mean
- Harmonic mean
- Median
- Mode
- Mean
- Measures of dispersion
- Standard deviation
- Variance
- Interquartile range
- Range
Categorical variables
Univariate analysis
| Characteristic | N = 50 |
|---|---|
| Treatment Type, n (%) | |
| Old Drug | 22 (44.0) |
| New Drug | 28 (56.0) |
| Sex, n (%) | |
| Female | 26 (52.0) |
| Male | 24 (48.0) |
| Age Grouping, n (%) | |
| Middle age | 17 (34.0) |
| Elderly | 33 (66.0) |
Bivariate analysis
| Treatment Type | Total | ||
|---|---|---|---|
| Old Drug | New Drug | ||
| Sex | |||
| Female | 11 (42%) | 15 (58%) | 26 (100%) |
| Male | 11 (46%) | 13 (54%) | 24 (100%) |
| Total | 22 (44%) | 28 (56%) | 50 (100%) |
Categorical variables
Bivariate tables
| Characteristic | 1">Overall, N = 501 | Treatment given | |
|---|---|---|---|
| Old Drug, N = 22 | New Drug, N = 28 | ||
| Sex, n (%) | |||
| Female | 26 (52.0) | 11 (50.0) | 15 (53.6) |
| Male | 24 (48.0) | 11 (50.0) | 13 (46.4) |
| Age Grouping, n (%) | |||
| Middle age | 17 (34.0) | 7 (31.8) | 10 (35.7) |
| Elderly | 33 (66.0) | 15 (68.2) | 18 (64.3) |
| 1 n (%) | |||
Categorical variables plots
Pie Chart

Bar Chart - Univariate

Categorical variables plots
Barchart - Bivariate


Measures of Asociation
Risk
- Risk (probability, likelihood)
- Probability of outcome in a specified period
- If 200 children in a boarding school ate rice and 28 had diarrhea then
Re=28200=0.14=14%
Odds
=Risk of getting the disease(Risk of not getting the disease) Oddse=0.141−0.14=0.140.86≈0.16
Measures of association
Risk Ratio (RR)
=Incidence in the exposedIncidence in the non−exposed=ReRu
- Used for estimation of causal relationship
- Can be calculated in cohort studies
- Higher RR => Better causal relationship
- RR=1 => No evidence of association
- RR ≠ 1 => Exposure is harmful or protective
Measures of association
Odds Ratio (OR)
=Odds in the exposedOdds in the non−exposed=OddseOddsu
- Used for estimation of causal relationship
- Can be calculated in case-control studies
- Higher RR => Better causal relationship
- OR=1 => No evidence of association
- OR ≠ 1 => Exposure is harmful or protective
Descriptive statistics
Measures of central tendency
- Mean
- Median
- Mode
Measure of Dispersion
- Range – Minimum to maximum
- Interquartile range
- p25 - p75
- Quartiles
- Minimum, p25, p75, maximum
- Standard Deviation
- Variance
Descriptive Statistics
| Characteristic | N = 50 |
|---|---|
| Initial blood pressure (mmHg) | |
| Median (IQR) | 97.7 (95.6, 99.4) |
| Mean (SD) | 98.3 (5.2) |
| Range | 87.5, 111.7 |
| Blood Pressure after treatment | |
| Median (IQR) | 88.2 (85.2, 92.1) |
| Mean (SD) | 88.6 (4.6) |
| Range | 78.0, 99.7 |
| Characteristic | Old Drug, N = 22 | New Drug, N = 28 |
|---|---|---|
| Initial blood pressure (mmHg) | ||
| Median (IQR) | 97.4 (95.5, 98.8) | 98.3 (95.9, 101.7) |
| Mean (SD) | 97.1 (3.6) | 99.2 (6.0) |
| Range | 89.8, 103.4 | 87.5, 111.7 |
| Blood Pressure after treatment | ||
| Median (IQR) | 91.9 (90.4, 93.6) | 85.4 (84.4, 87.2) |
| Mean (SD) | 92.2 (3.3) | 85.8 (3.3) |
| Range | 86.2, 99.7 | 78.0, 94.2 |
Descriptive Statistics
Histogram

Boxplot

Descriptive Statistics - plots
Scatter plot

Boxplot

Inferential statistics
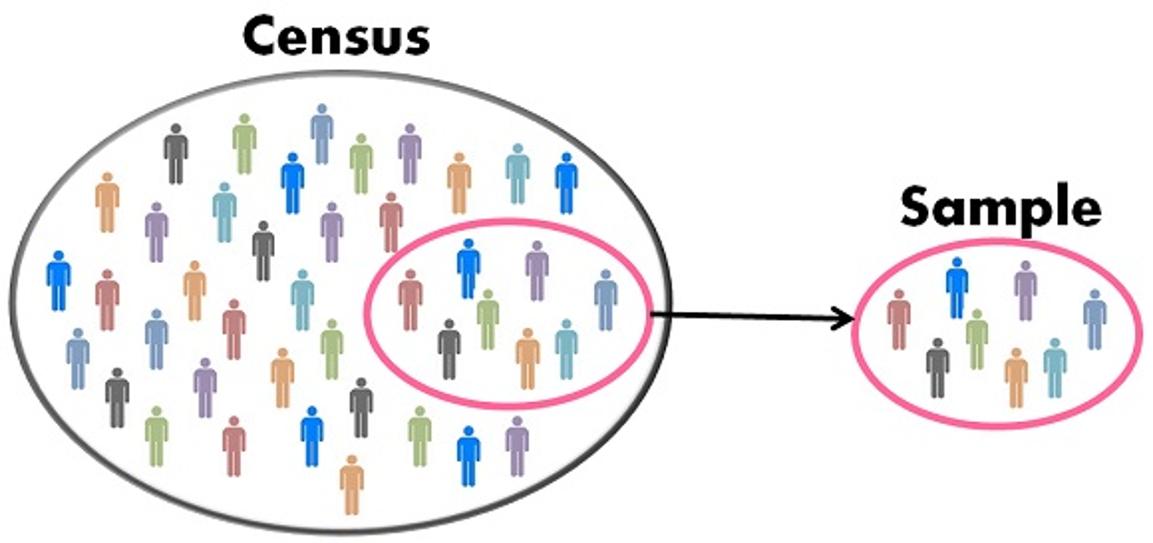
Sample vrs. Population
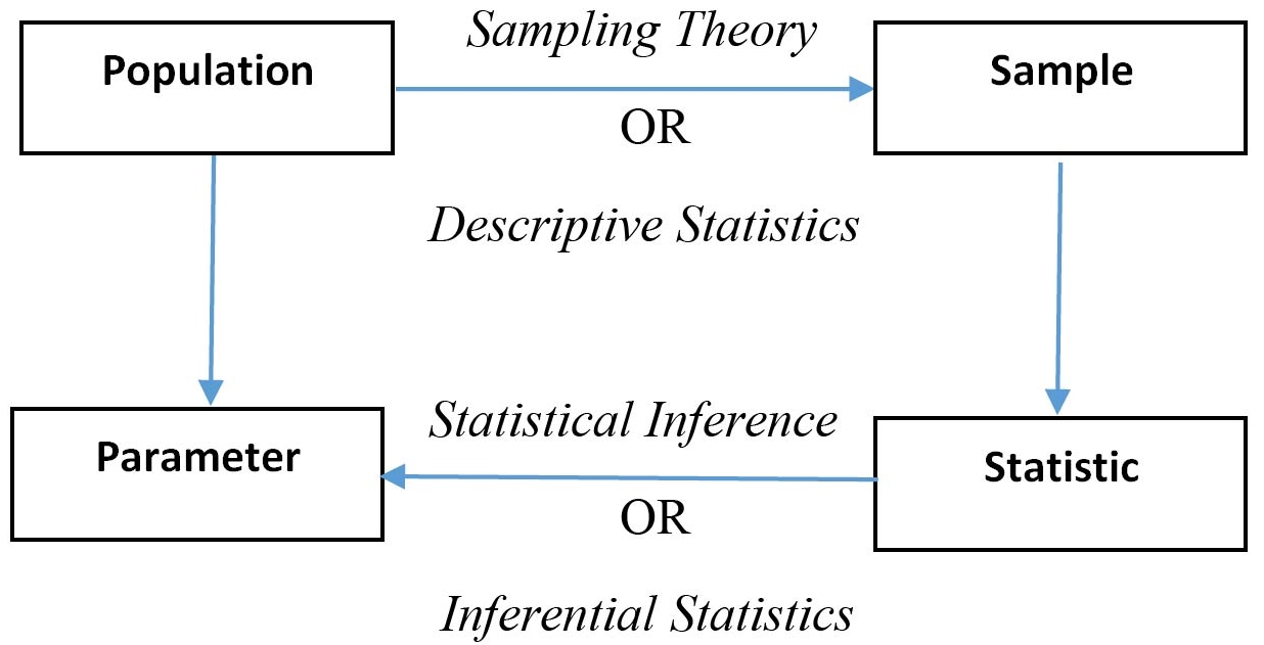
Statistic vrs. Parameter
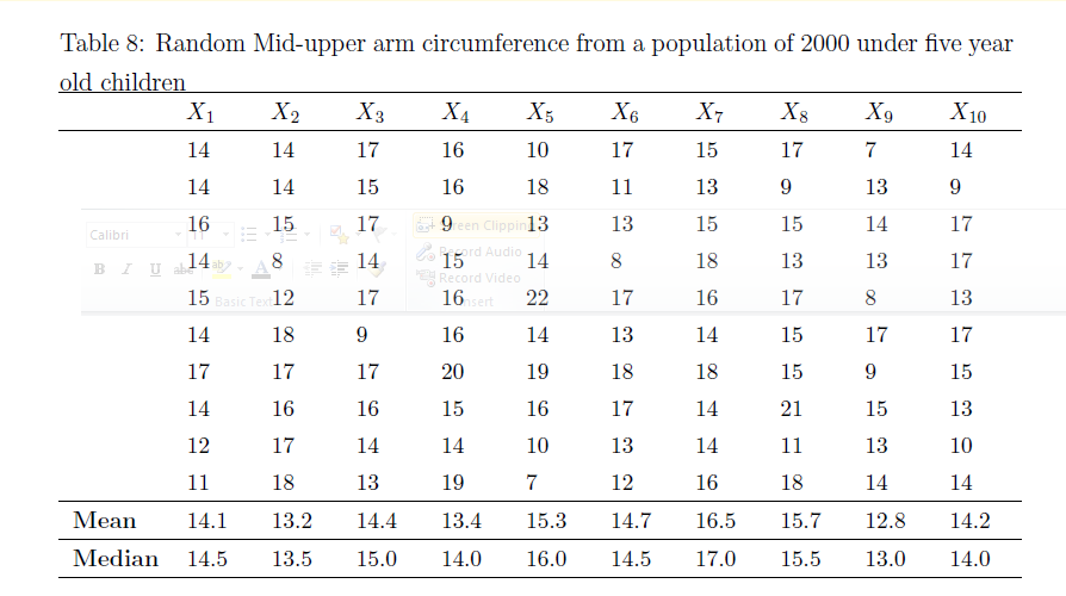
Sample variation
Estimates
- Point estimates
- Interval estimates
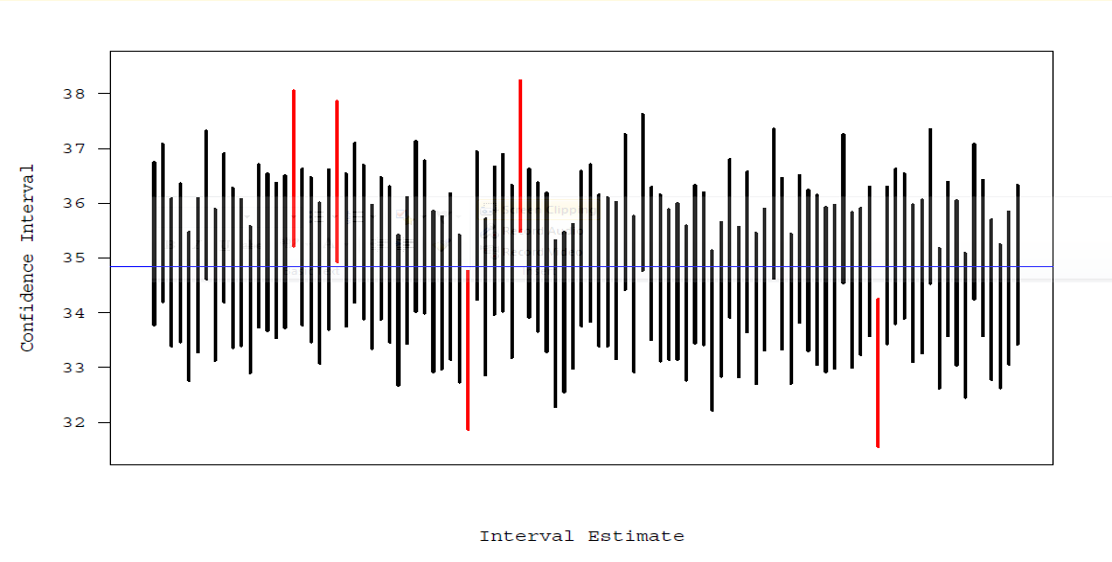
Confidence interval
The 95% confidence interval is the interval that is likely to contain the population parameter 95% of the time.
95% Confidence interval
p-value
- Well known in research
- Very often misinterpreted and overemphasized
It is the probability of having a statistic as extreme as the one observed from the sample if the null hypothesis is true. It determines the strength of support for the null hypothesis.
- The nearer p-value is to 1 the better the data at hand or test statistic supports the null value.
Hypothesis testing
- State (Null) hypothesis (H0)
- Decide on significance level (α) usually 0.05
- Determine sample size
- Collect data (Evidence)
- Apply appropriate statistical test
- Compute the probability value (p-value)
- We compare the p-value with α
- If p < α Then: Reject the H0 (Guilty)
- If p >= α Then: Refuse to reject the H0 (Not guilty)
Generally:
- Lower p-value: More confident of rejecting the H0
- Note that failure to reject H0 does not mean H0 is true. It means we do not have enough evidence to reject it
Statistical Tests
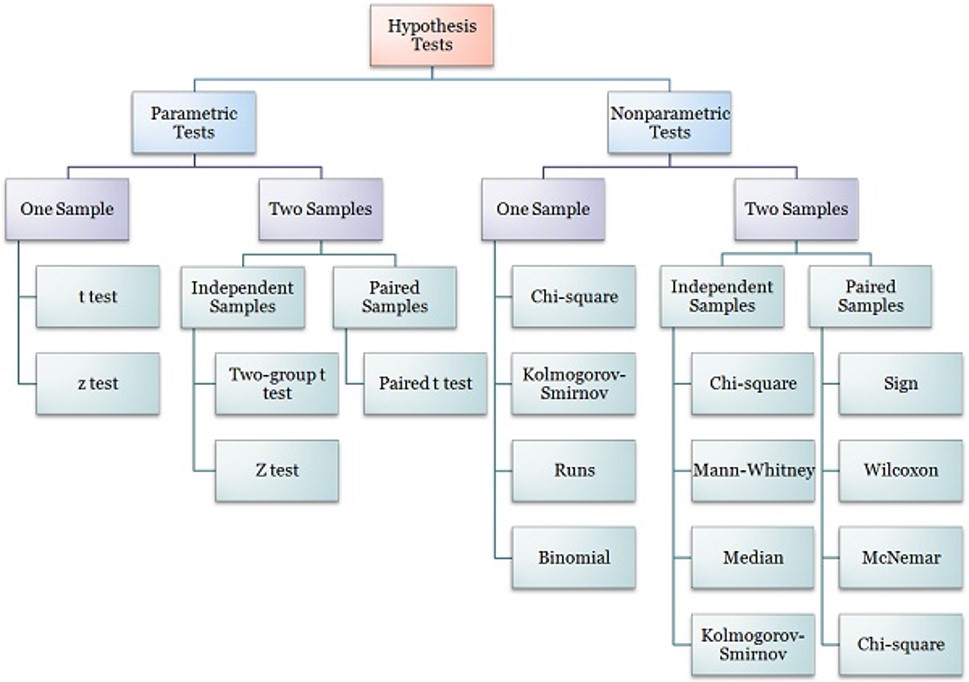
Answering our questions from our study
How much does the New drug lower the BP?
How much does the Control drug lower the BP?
Which of the two drugs lowers the BP better?
| Characteristic | 1">Old Drug, N = 221 | 2">95% CI2 | 1">New Drug, N = 281 | 2">95% CI2 |
|---|---|---|---|---|
| Change in Blood Pressure | 4.9 (2.3) | 3.9, 5.9 | 13.4 (5.7) | 11, 16 |
| 1 Mean (SD) | ||||
| 2 CI = Confidence Interval | ||||
Is there a difference in the BP lowering effect of the two drugs?
H0: No difference in BP lowering effect between the two drugs
| Characteristic | 1">Old Drug, N = 221 | 1">New Drug, N = 281 | 2">p-value2 |
|---|---|---|---|
| Change in Blood Pressure | 4.9 (2.3) | 13.4 (5.7) | <0.001 |
| 1 Mean (SD) | |||
| 2 Welch Two Sample t-test | |||
Conclusion: Based on the p-value we reject the H0 and thus conclude there is a significant difference between the BP lowering effect of the New drug and Control
Is the BP lowering effect related to the age of the patient?
H0: BP lowering effect is not related to age
| Characteristic | Beta | 1">95% CI1 | p-value |
|---|---|---|---|
| Age in years | 0.08 | -0.19, 0.36 | 0.5 |
| 1 CI = Confidence Interval | |||
Conclusion: BP lowering effect not significantly related to the age of the patient.

| Characteristic | 1">Overall, N = 501 | Drug | 2">p-value2 | |
|---|---|---|---|---|
| 1">Old Drug, N = 221 | 1">New Drug, N = 281 | |||
| Age in years | 61.5 (6.5) | 62.1 (6.6) | 61.0 (6.5) | 0.6 |
| Sex | 0.8 | |||
| Female | 26.0 (52.0%) | 11.0 (50.0%) | 15.0 (53.6%) | |
| Male | 24.0 (48.0%) | 11.0 (50.0%) | 13.0 (46.4%) | |
| Initial blood pressure (mmHg) | 98.3 (5.2) | 97.1 (3.6) | 99.2 (6.0) | 0.13 |
| Blood Pressure after treatment | 88.6 (4.6) | 92.2 (3.3) | 85.8 (3.3) | <0.001 |
| Change in Blood Pressure | 9.7 (6.2) | 4.9 (2.3) | 13.4 (5.7) | <0.001 |
| Age Grouping | 0.8 | |||
| Middle age | 17.0 (34.0%) | 7.0 (31.8%) | 10.0 (35.7%) | |
| Elderly | 33.0 (66.0%) | 15.0 (68.2%) | 18.0 (64.3%) | |
| 1 Mean (SD); n (%) | ||||
| 2 Welch Two Sample t-test; Pearson’s Chi-squared test | ||||
Summary...
Data Management
- Database design
- Data entry
- Data validation
- Data verification
- Data cleaning
- Data warehousing
- Data transfer
Data Analysis
- Statistical software
- Data cleaning
- Data analysis
- Continuous variables
- Categorical variables
- Descriptive vrs. Inferential
- Presentation of results
- Tables
- Figures
Thank you!!!